

Project Arachnid and the need for a proactive stance
By David Ranner from CameraForensics and Lloyd Richardson from the Canadian Centre for Child Protection
7 October, 2021
By Nathaniel Trevivian

Work seems to follow seasons here at CameraForensics.
From October through to April we’re really busy on projects for specific clients, and after the financial end of year we get some time to breathe, take stock of what we’ve done and refocus on what we want to achieve going forward. This is a great time for us to conduct maintenance, review our processes, and think about how we can make them lighter, faster and more reliable than ever.
In the last year we experienced great opportunities to learn something new about the tech stack we were using, as well as our workflows and responses. Coming into the maintenance cycle, we decided it would be a really good time to improve our monitoring and observability.
While we already had monitoring and observation processes in place - with dashboards for monitoring the crawlers and Elasticsearch clusters, as well as shipping and analysing logs and metrics for most of the various components of our architecture, it wasn’t consistent or co-located.
For example, we could see response times to user queries from our user experience dashboards, as well as processing load on BigSearch, and the Elasticsearch clusters separately. However, if we got an alert saying that the Elasticsearch cluster was suppressing REST (a sign that it was well overworked), we were sent scurrying across the dashboards to try and identify where the extra load was from - such as a rogue user smashing our API or a data update script run as part of our enrichment that was a bit too aggressive. Looking all over the place took time, and we weren’t shipping all our logs, either. You only have to scp down a bunch of tar.gz logs to analyse in a file editor once before you realise that it’s not how it should be done.
So we took some time to rethink and rework our monitoring and observability to better suit our needs.
When setting up monitoring and observability, we needed to be sure the purposes of monitoring were clearly communicated. This led onto the “what”: in order to have access to that useful monitoring data, what did we have to monitor? Whilst it’s possible to observe everything to the n-th degree, that isn’t always helpful or necessary. So what was helpful?
There were three main classes of monitoring data that we were interested in:
As our data grew, we needed to ensure that we monitored the system performance. How did that affect rate limits on user queries, or crawl performance? Also, how did each component affect other components? For example - how did the pressure that the crawlers put on the database affect user queries? If we introduced new ways of querying, how did that affect the system performance?
Was anyone using the new features we put in? Are we offering features that never get used, indicating a training gap, or features that could just be removed to simplify things? What was it like for the users to actually use our system? Were they getting useful results, and how could we identify data sources that we should focus more on?
Monitoring security is essential in protecting sensitive data. Was there any suspicious behaviour on any part of our system? Were we tracking issues that indicate a potential outage about to happen?
Some of this was reactive monitoring - evaluating how and why events occured, as well as assessing the best way to fix it as quickly as possible. Some was also proactive, like the feature use tracking mentioned previously.
Above all else, we wanted a single location to analyse everything under one big picture. Somewhere we could find the root cause of events, to help us decide what sort of action, if any, was required, as well as a location to see how often new features and components were used.
We felt that a single point of analysis and comparison was important because we knew that, as much as we didn’t want them to, backend operations affected user experience.
Aggregating all of our monitoring data into a single place for analysis was one of the main desired outcomes.
For example, a data update script smashing Elasticsearch meant slower user queries, potentially rejecting BigSearch queries, which in turn meant BigSearch throttling and users waiting longer for results.
We wanted to get an overall picture of each component, and the platform supporting it from the ground up. We have a number of components in our architecture. Some are backend processing apps that run on their own VMs and are written in a variety of languages. We have some user interfaces, public APIs, an nginx or two, and a couple of Elasticsearch clusters.
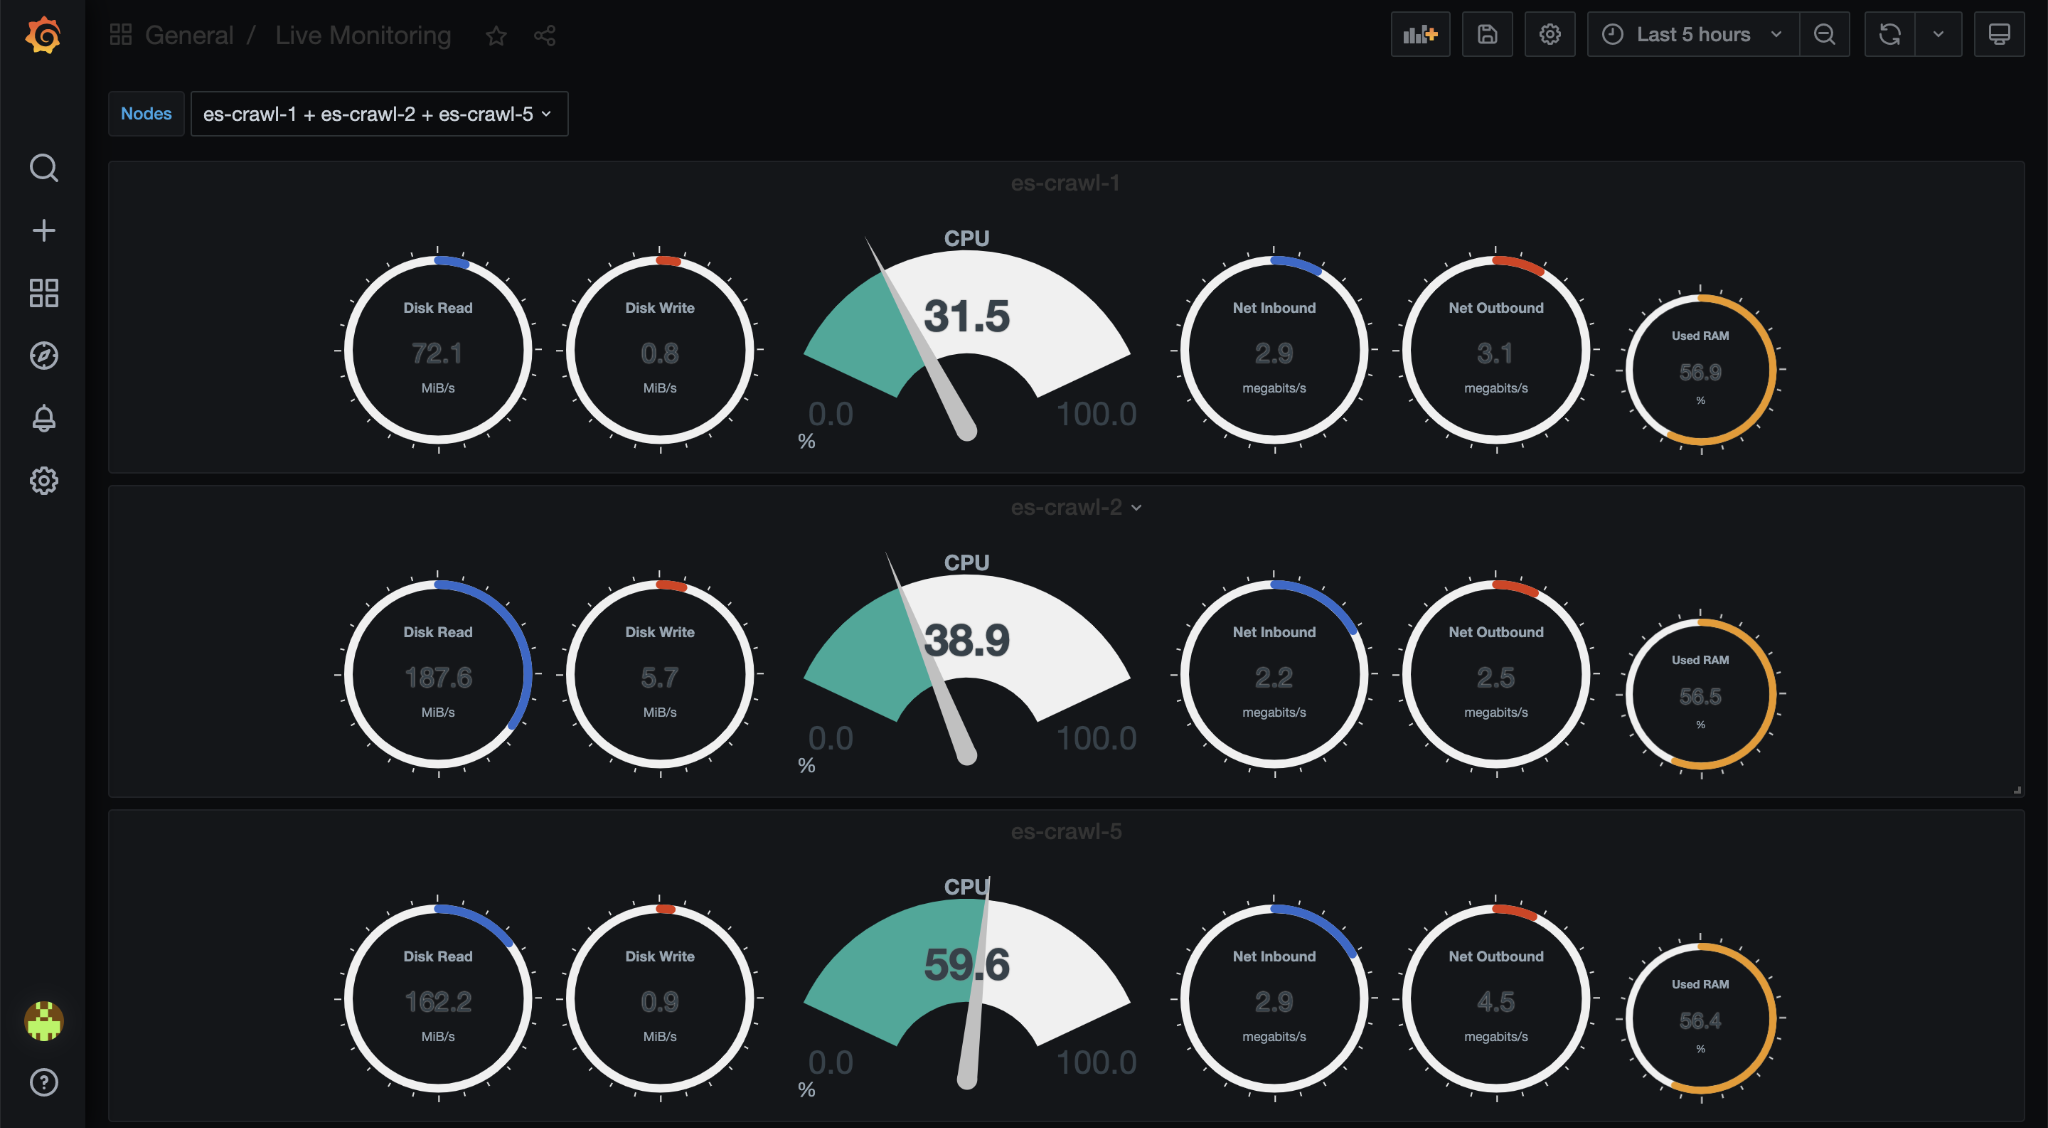
Monitoring these VMs was a core requirement for us. We wanted to see what’s going on on the VMs at any point in time, monitor real time performance of VM resources, see CPU and RAM usage as it happened, disk utilisation and network IO, as well as introducing alerts.
We also wished to:
We wanted to ship my application logs and metrics and create dashboards based on events logged there, and then create alerts from those events. All in all, we were very demanding, and we needed tools to meet those demands.
First of all, I need to point out that there are plenty of great companies offering cloud based monitoring packages which may or may not come within your budget - the Sematexts and Datadogs of this world, not forgetting Elastic Cloud, and plenty more besides. These tools come with great features and brilliant expert knowledge on observability, threat analysis and more.
We decided not to opt for any of those packages for a number of reasons:
There are so, so many great monitoring tools out there that each achieve different things albeit with some large overlaps. Here are some of the tools that we’re using:
Netdata shows you low latency performance data on pretty much every part of your platform you can imagine, and more besides. It also has community-contributed modules that you can install to monitor specific pieces, like Elasticsearch, docker and nginx.
What I also love about netdata is that it’s very easy to create your own custom dashboards with charts you select. In this way, you can monitor an entire cluster in realtime on one page if you like.
Netdata charts inside of Grafana - what is this voodoo?!
Netdata is great if you get an alert on high CPU or RAM usage, for example, and you want to monitor that in real time on the VM in question.
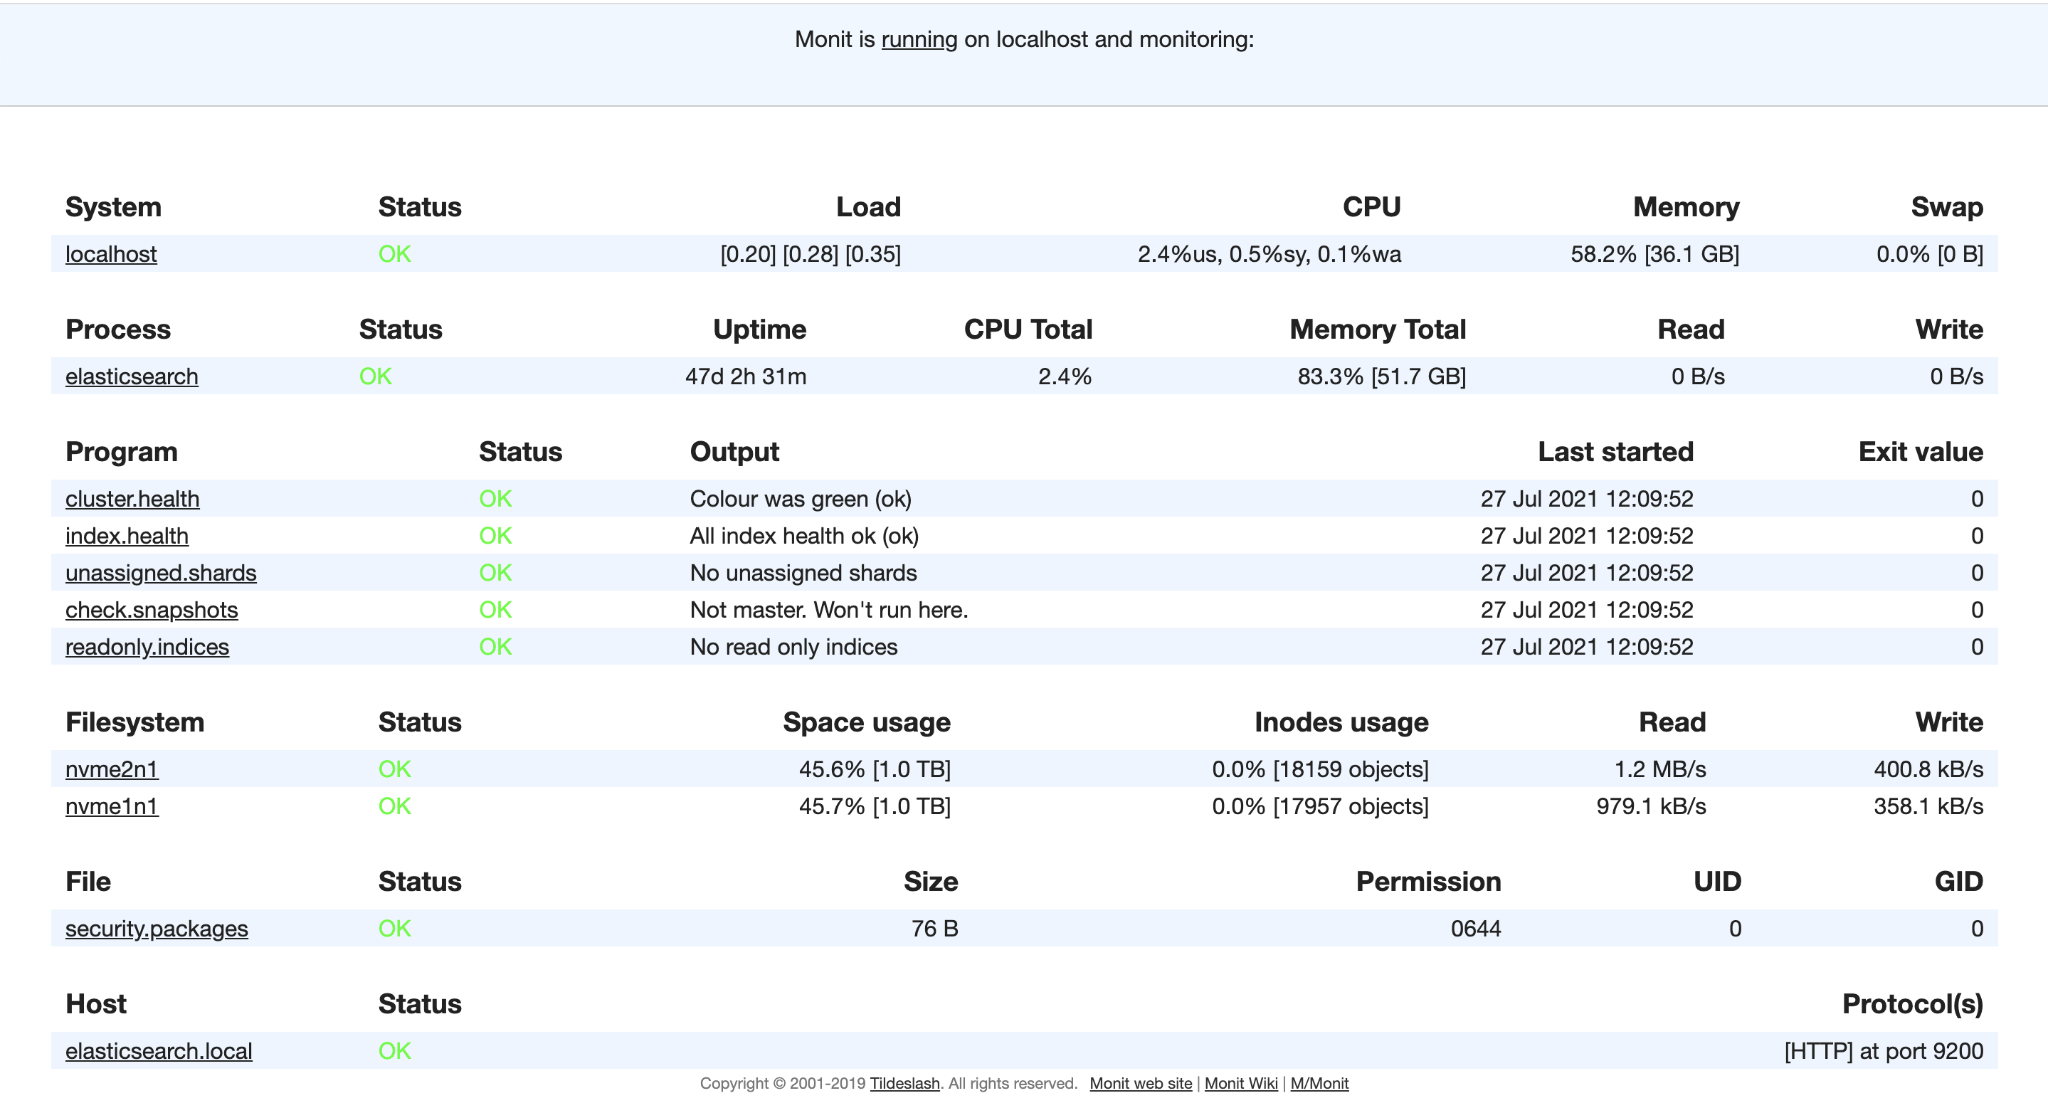
When you’re a small company without a dedicated devops team, you don’t have the resources to sit around watching things all day. Instead you need a stack that’s going to tell you when it’s having problems, which is where Monit comes in. Monit is great for giving you alerts on real time disk space usage, high memory thrashing and warnings about security packages that needed to be installed amongst other things.
Example alerts that we get from Monit to our #devops slack channel
It’s a small daemon application that runs on each server and performs useful tasks such as:
Monit can also run custom scripts and alert you based on the outcome. For example, you could write a script that checks for unassigned shards on an Elasticsearch cluster and then have Monit tell you when they occur. You can even have a script that checks whether last night’s backup actually ran or not.
Monit comes with an HTML dashboard so that you can see check statuses and suspend checks if they’re becoming annoying.
Example Monit dashboard page from one of our Elasticsearch instances
There’s also a separate product (M/Monit) where Monit dashboards from across your architecture can be aggregated into a single area, and an API if you wanted to extract the information yourself.
Elastic offer a number of beats that are all really useful. Data is gathered - what data this is depends on the beat you’re using - and is then indexed into an Elasticsearch cluster through an ingestion pipeline, which you can use to enrich the data further (for example: geolocating an IP address).
Some processing is possible by the beats themselves using the processing pipeline.
You don’t have to index the data into Elasticsearch, other outputs are possible, but Elasticsearch worked well for us because we were already indexing application usage metrics and crawler metrics into Elasticsearch.
We used filebeat for indexing system and application logs into an Elasticsearch cluster for further analysis. We also used it to ingest ELB logs stored on S3, and logs written to CloudWatch by ECS services.
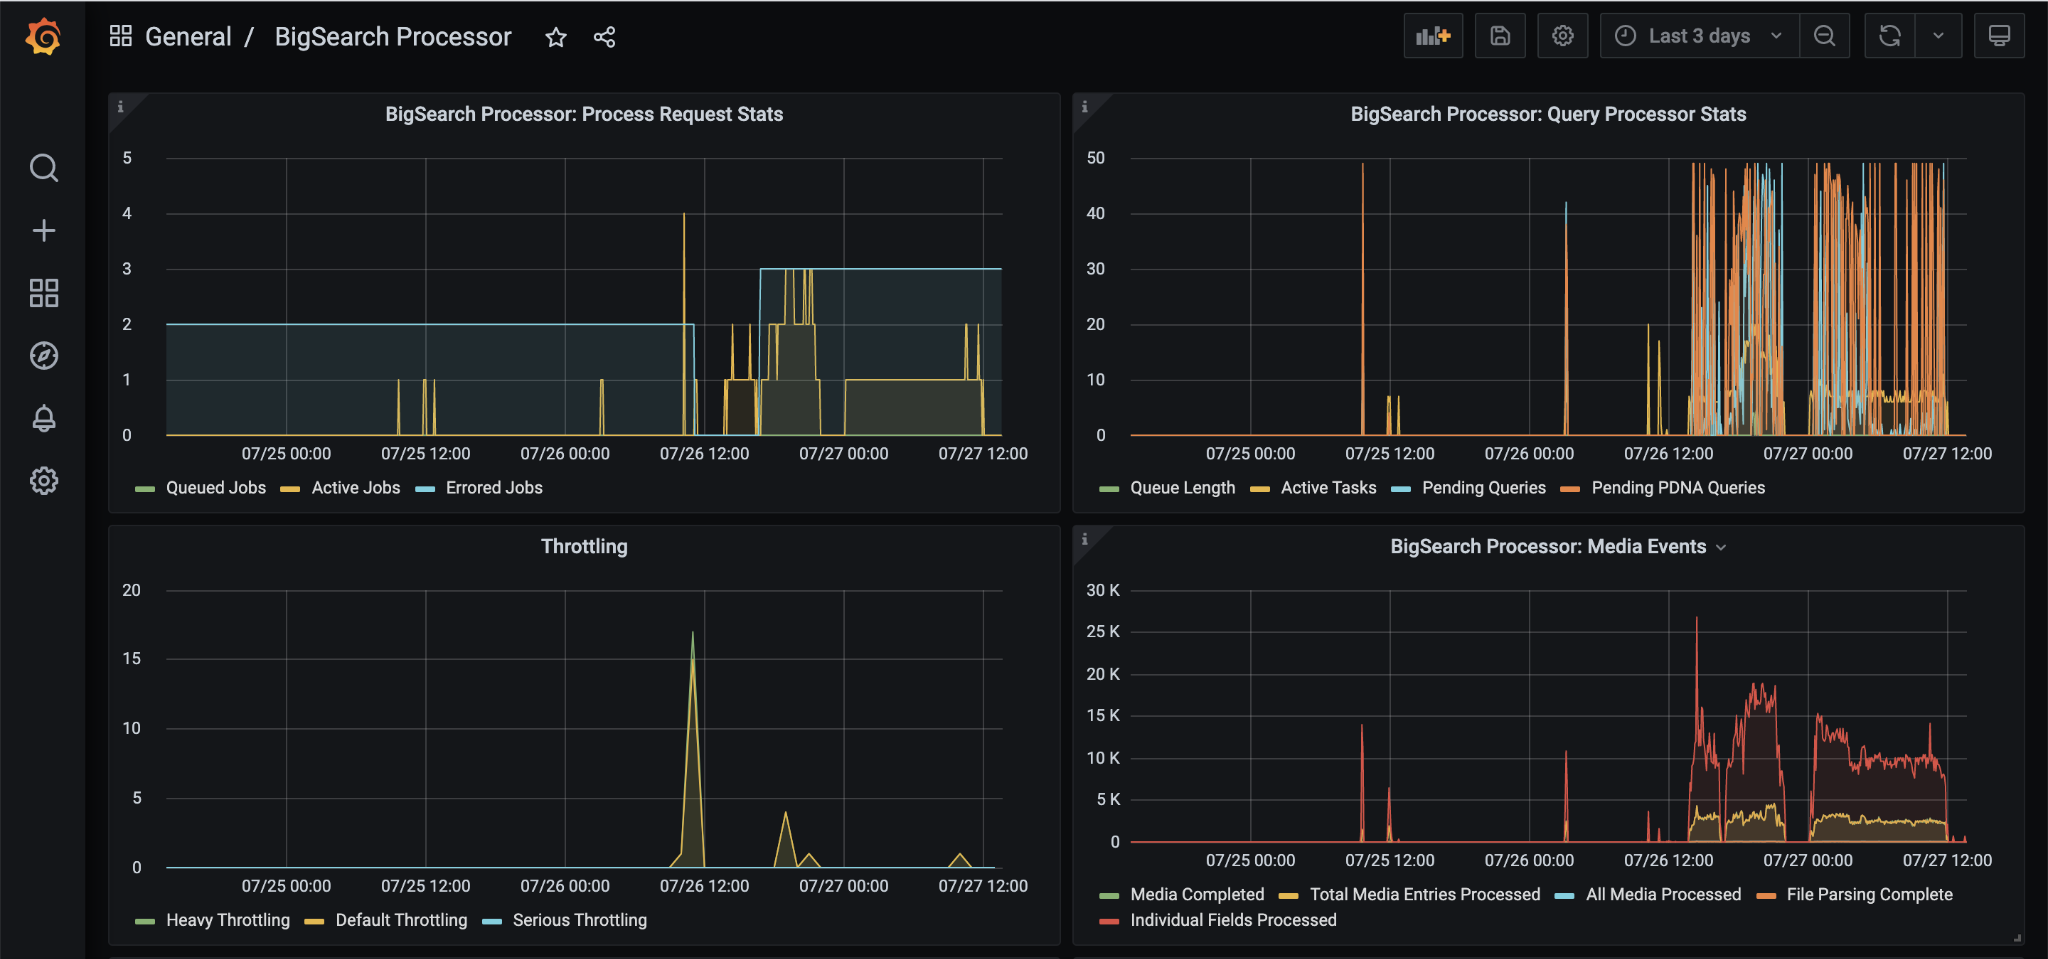
Part of a dashboard deriving metrics from BigSearch Processor logs
We used Metricbeat for indexing data about the VMs we were running - basically, everything that Netdata does but with an indexing lag. The indexing lag is actually what drove us to keep netdata around. There’s a big overlap between netdata and metricbeat, but viewing netdata’s real time dashboards when there’s a problem happening makes you feel like you’re getting the information at exactly the time you need it.
We used Auditbeat to record commands being run on all of our instances. This enabled us to look for suspicious commands and create alerts accordingly.
Finally, we used Heartbeat to ping services and index healthcheck and uptime data - this was especially useful when used in conjunction with SpringBoot’s Actuator.
I previously mentioned that one of our main monitoring requirements was in seeing dashboards relating to user and system metrics from across the architecture in a single place. In our case, this single place became Grafana.
We used to use Kibana, but unfortunately the license cost for monitoring multiple Elasticsearch clusters from a single Kibana instance was unpalatable, quoted at over £3,600 per node with no indication as to the recurrence charges.
In comparison, a single Grafana container run on ECS FARGATE costs us less than $59/month, making it a cost-effective, efficient solution.
Grafana is essential in enabling you to create visualisations of time-indexed data. It doesn’t just do time-indexed data, but that’s what it’s best at.
It can be configured with multiple data sources enabling you to bring metrics in from across your stack, and there is a valuable pool of community contributed dashboards free to use.
The team at Grafana Labs recently released Loki - a log indexing piece that works seamlessly with Grafana. We looked into using this, because it looked great, but as we were already using Elastic beats, and were shipping logs to an Elasticsearch cluster we decided to maintain this solution. The Grafana log panel works just fine with filebeat-indexed logs from an Elasticsearch datasource.
The community surrounding Grafana, and the openness of the team behind it are a lot of what makes it great. There’s a very active online discussion group that will help with questions or problems, and a slack group where you can stay up to date with updates, news on conferences and webinars, and raise UX problems.
Grafana was the final piece in our puzzle. We simply targeted the various indexes in our metrics cluster with datasource configurations and built the dashboards we needed.
Grafana is more than just dashboards - it also offers an alerting system based on metric values, and we’re going to be investigating that side of it in the near future.
The best thing about all of the tools mentioned above are that they’re free to use, and most are open source. Obviously you have to make sure that they’re installed and configured correctly, and we do that using our configuration management system.
There’s also a factor of ongoing maintenance, which shouldn’t be ignored: upgrading the various tools as and when upgrades become available, but that’s true of most of our stack. We aim to keep abreast of updates from Elasticsearch to SpringBoot and everything in between, and our configuration management system is set up to handle upgrades as and when we want to deploy them.
To learn more about our intensive focus on R&D, as well as our commitment to furthering our mission, visit our research and development page here.